Analytics for Nursing Home Leadership Teams and Board Members
Whether you are preparing for a board meeting or looking for competitive data intelligence on the nursing homes in your area, we provide a consultative approach to understand which datasets would be most beneficial to supporting your business objectives.
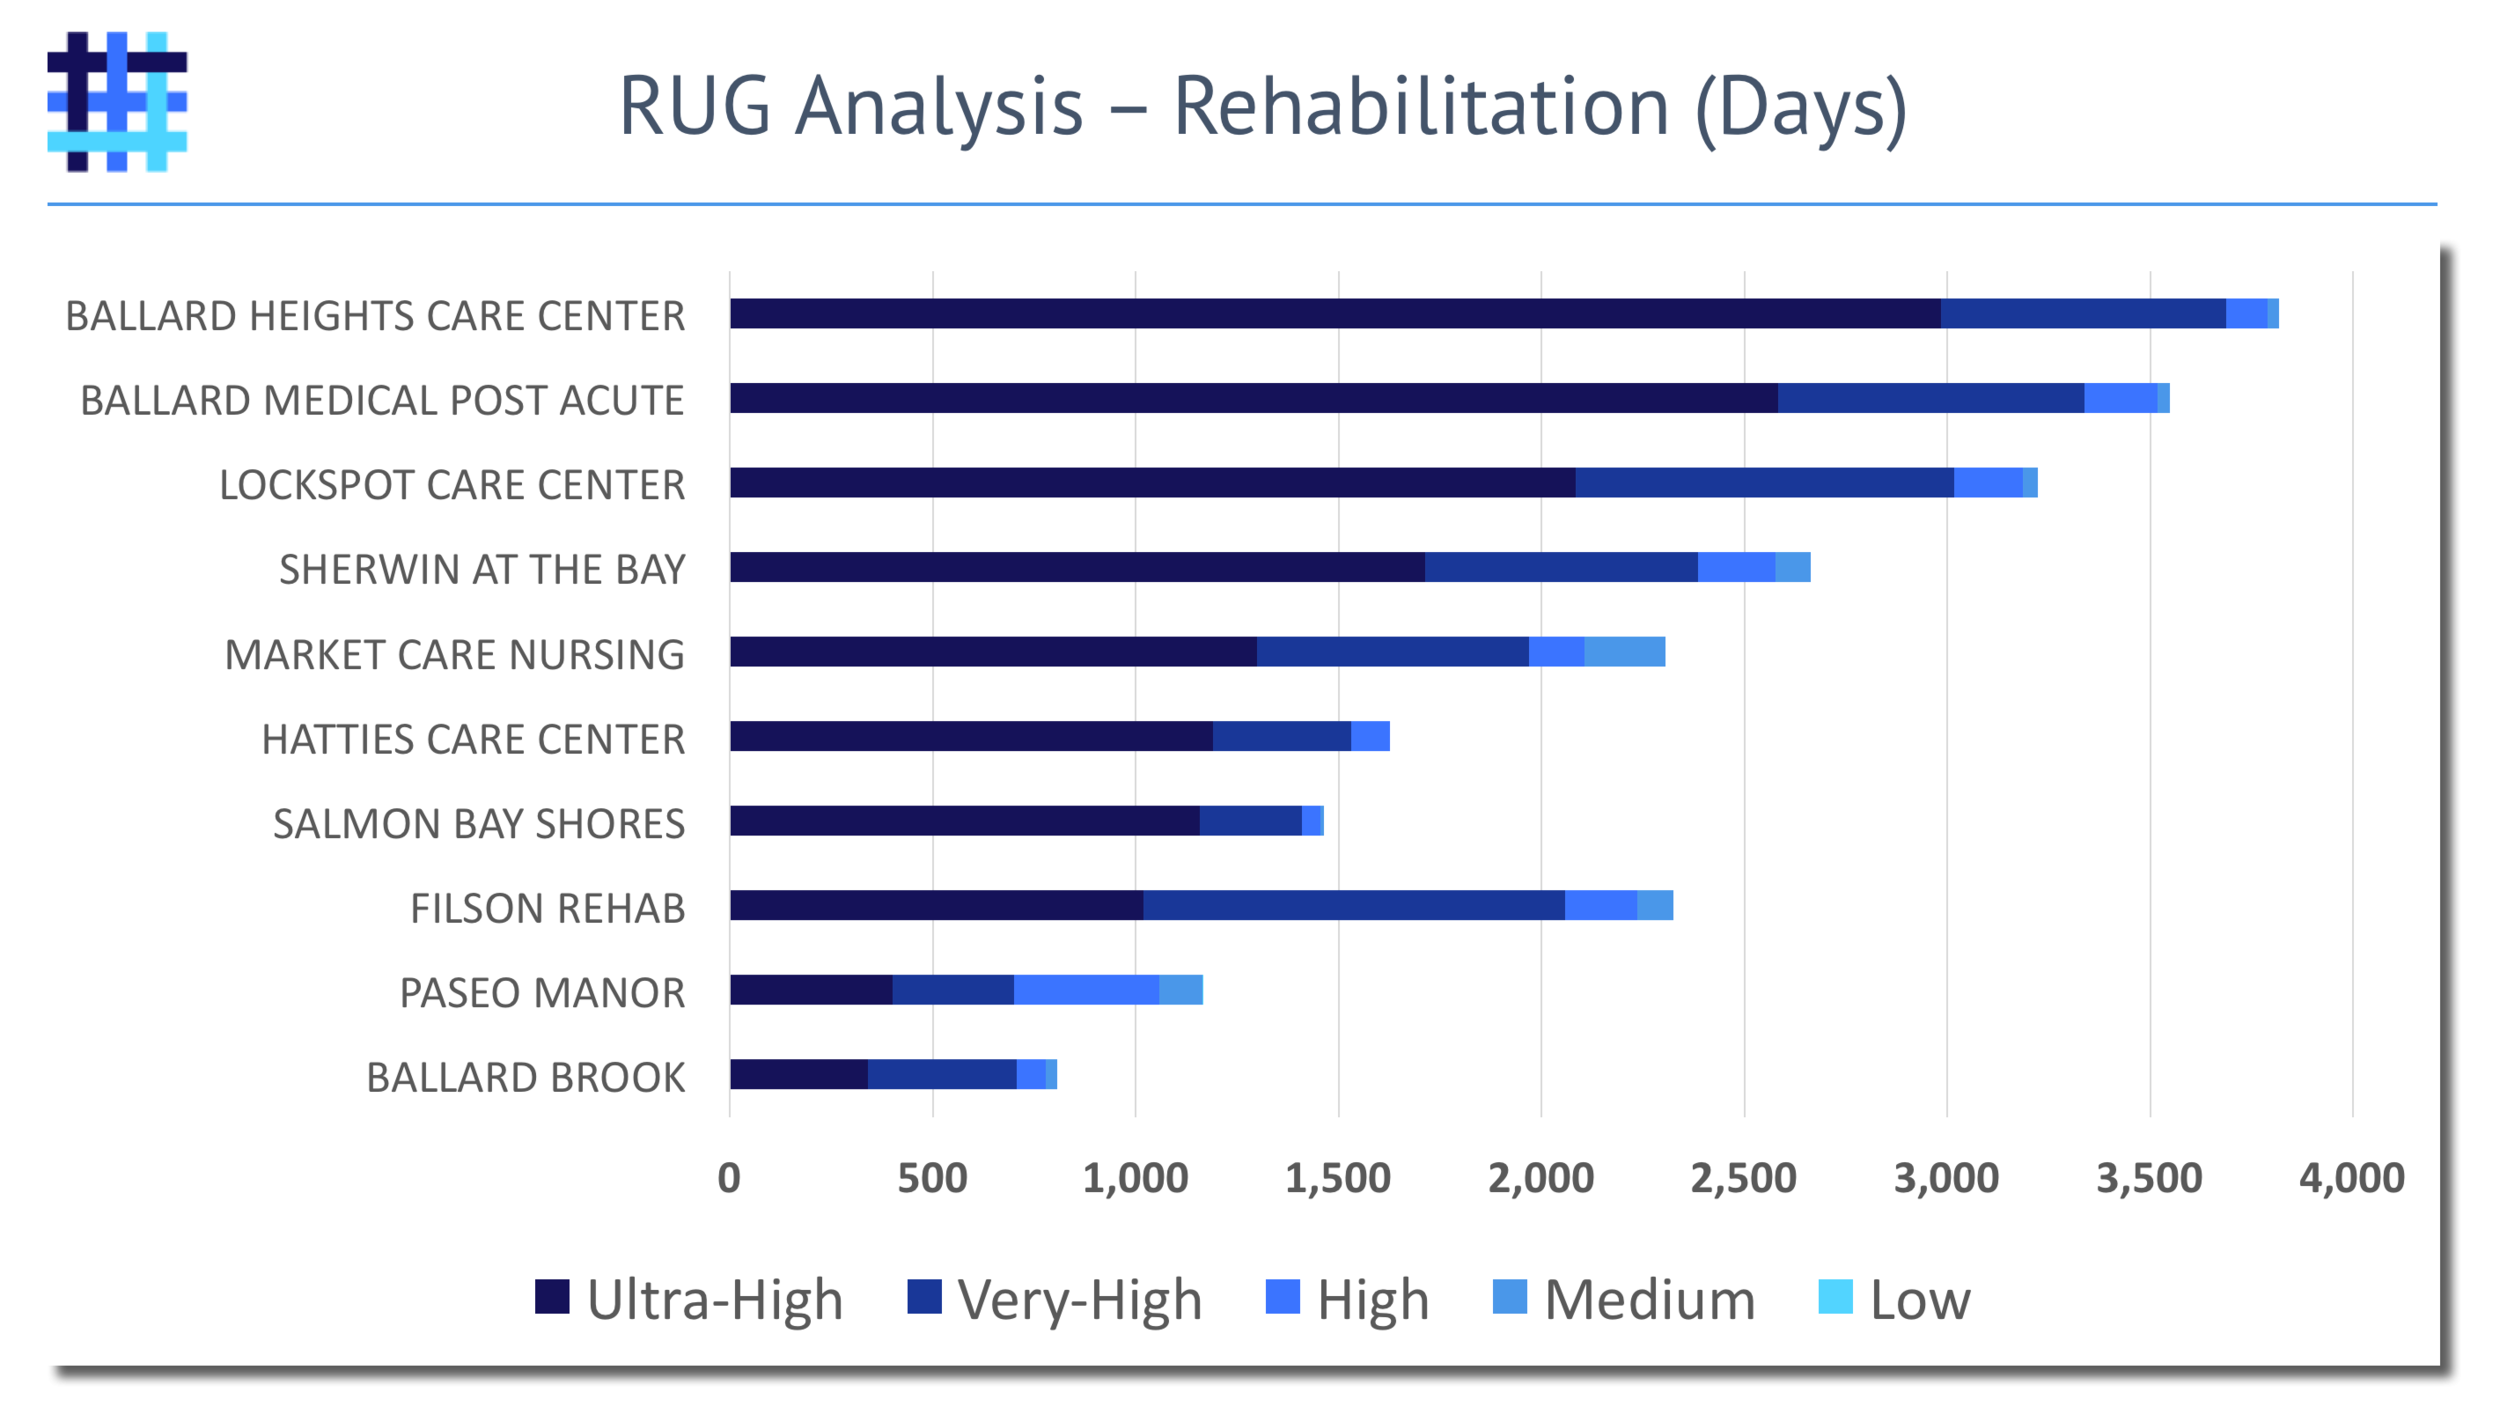
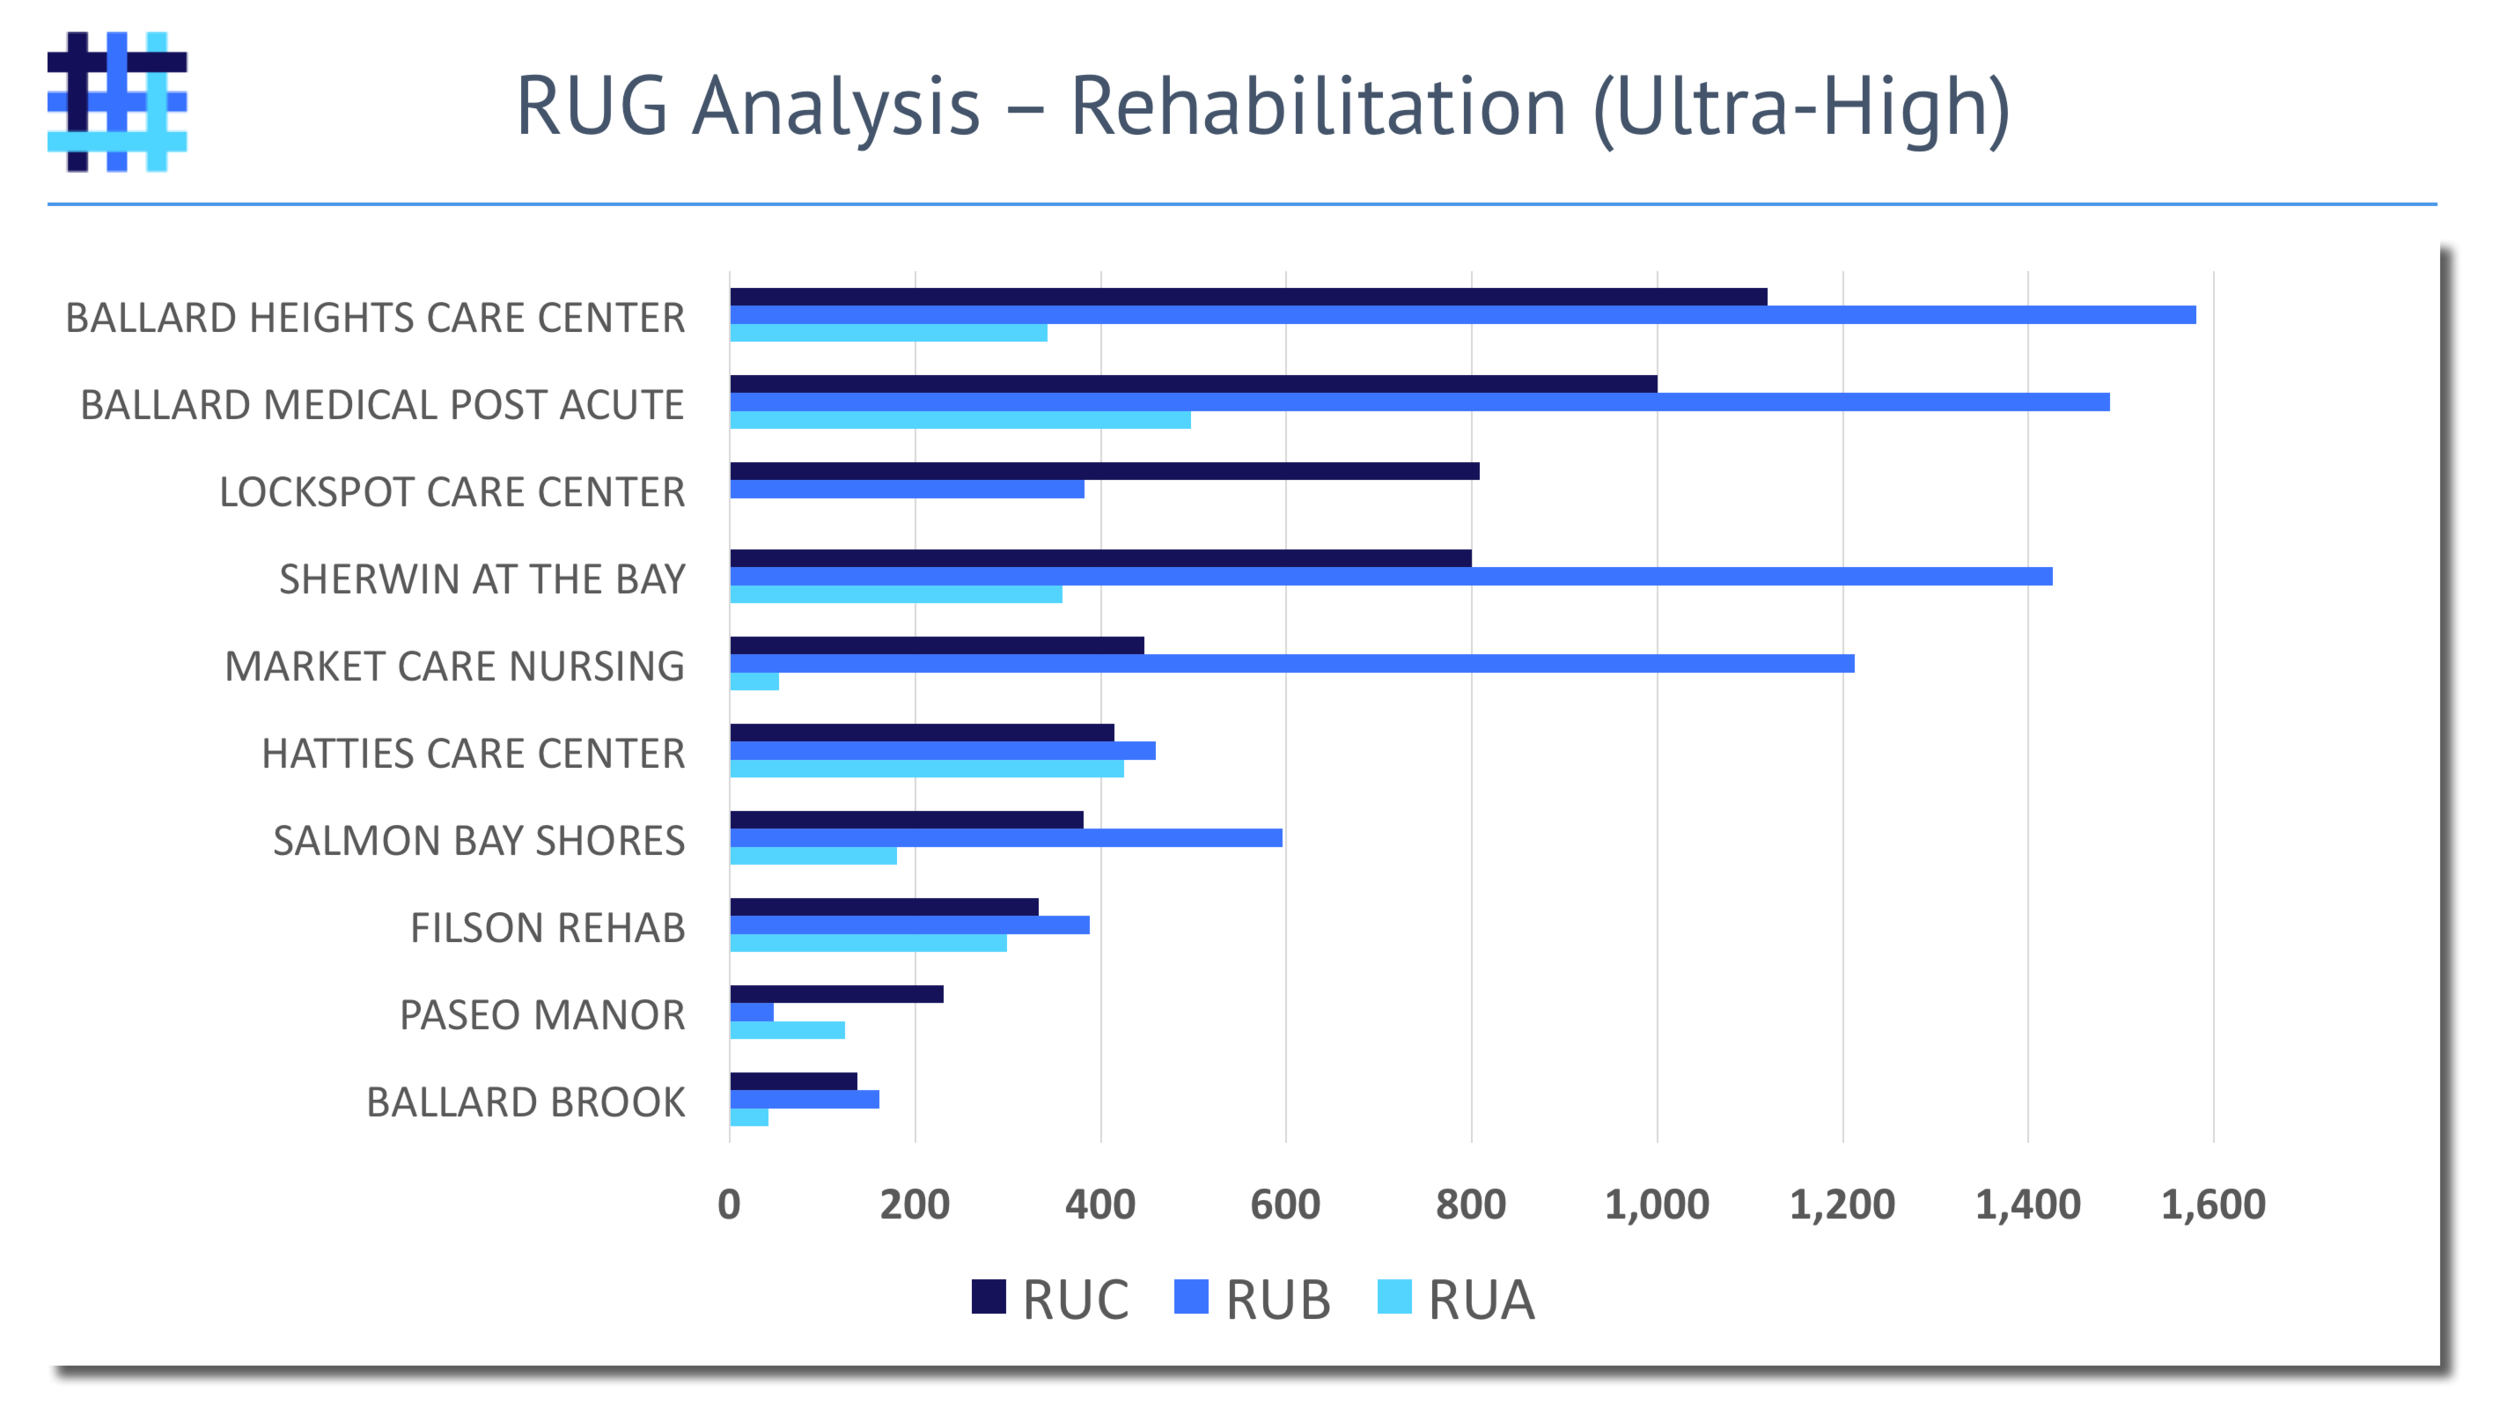
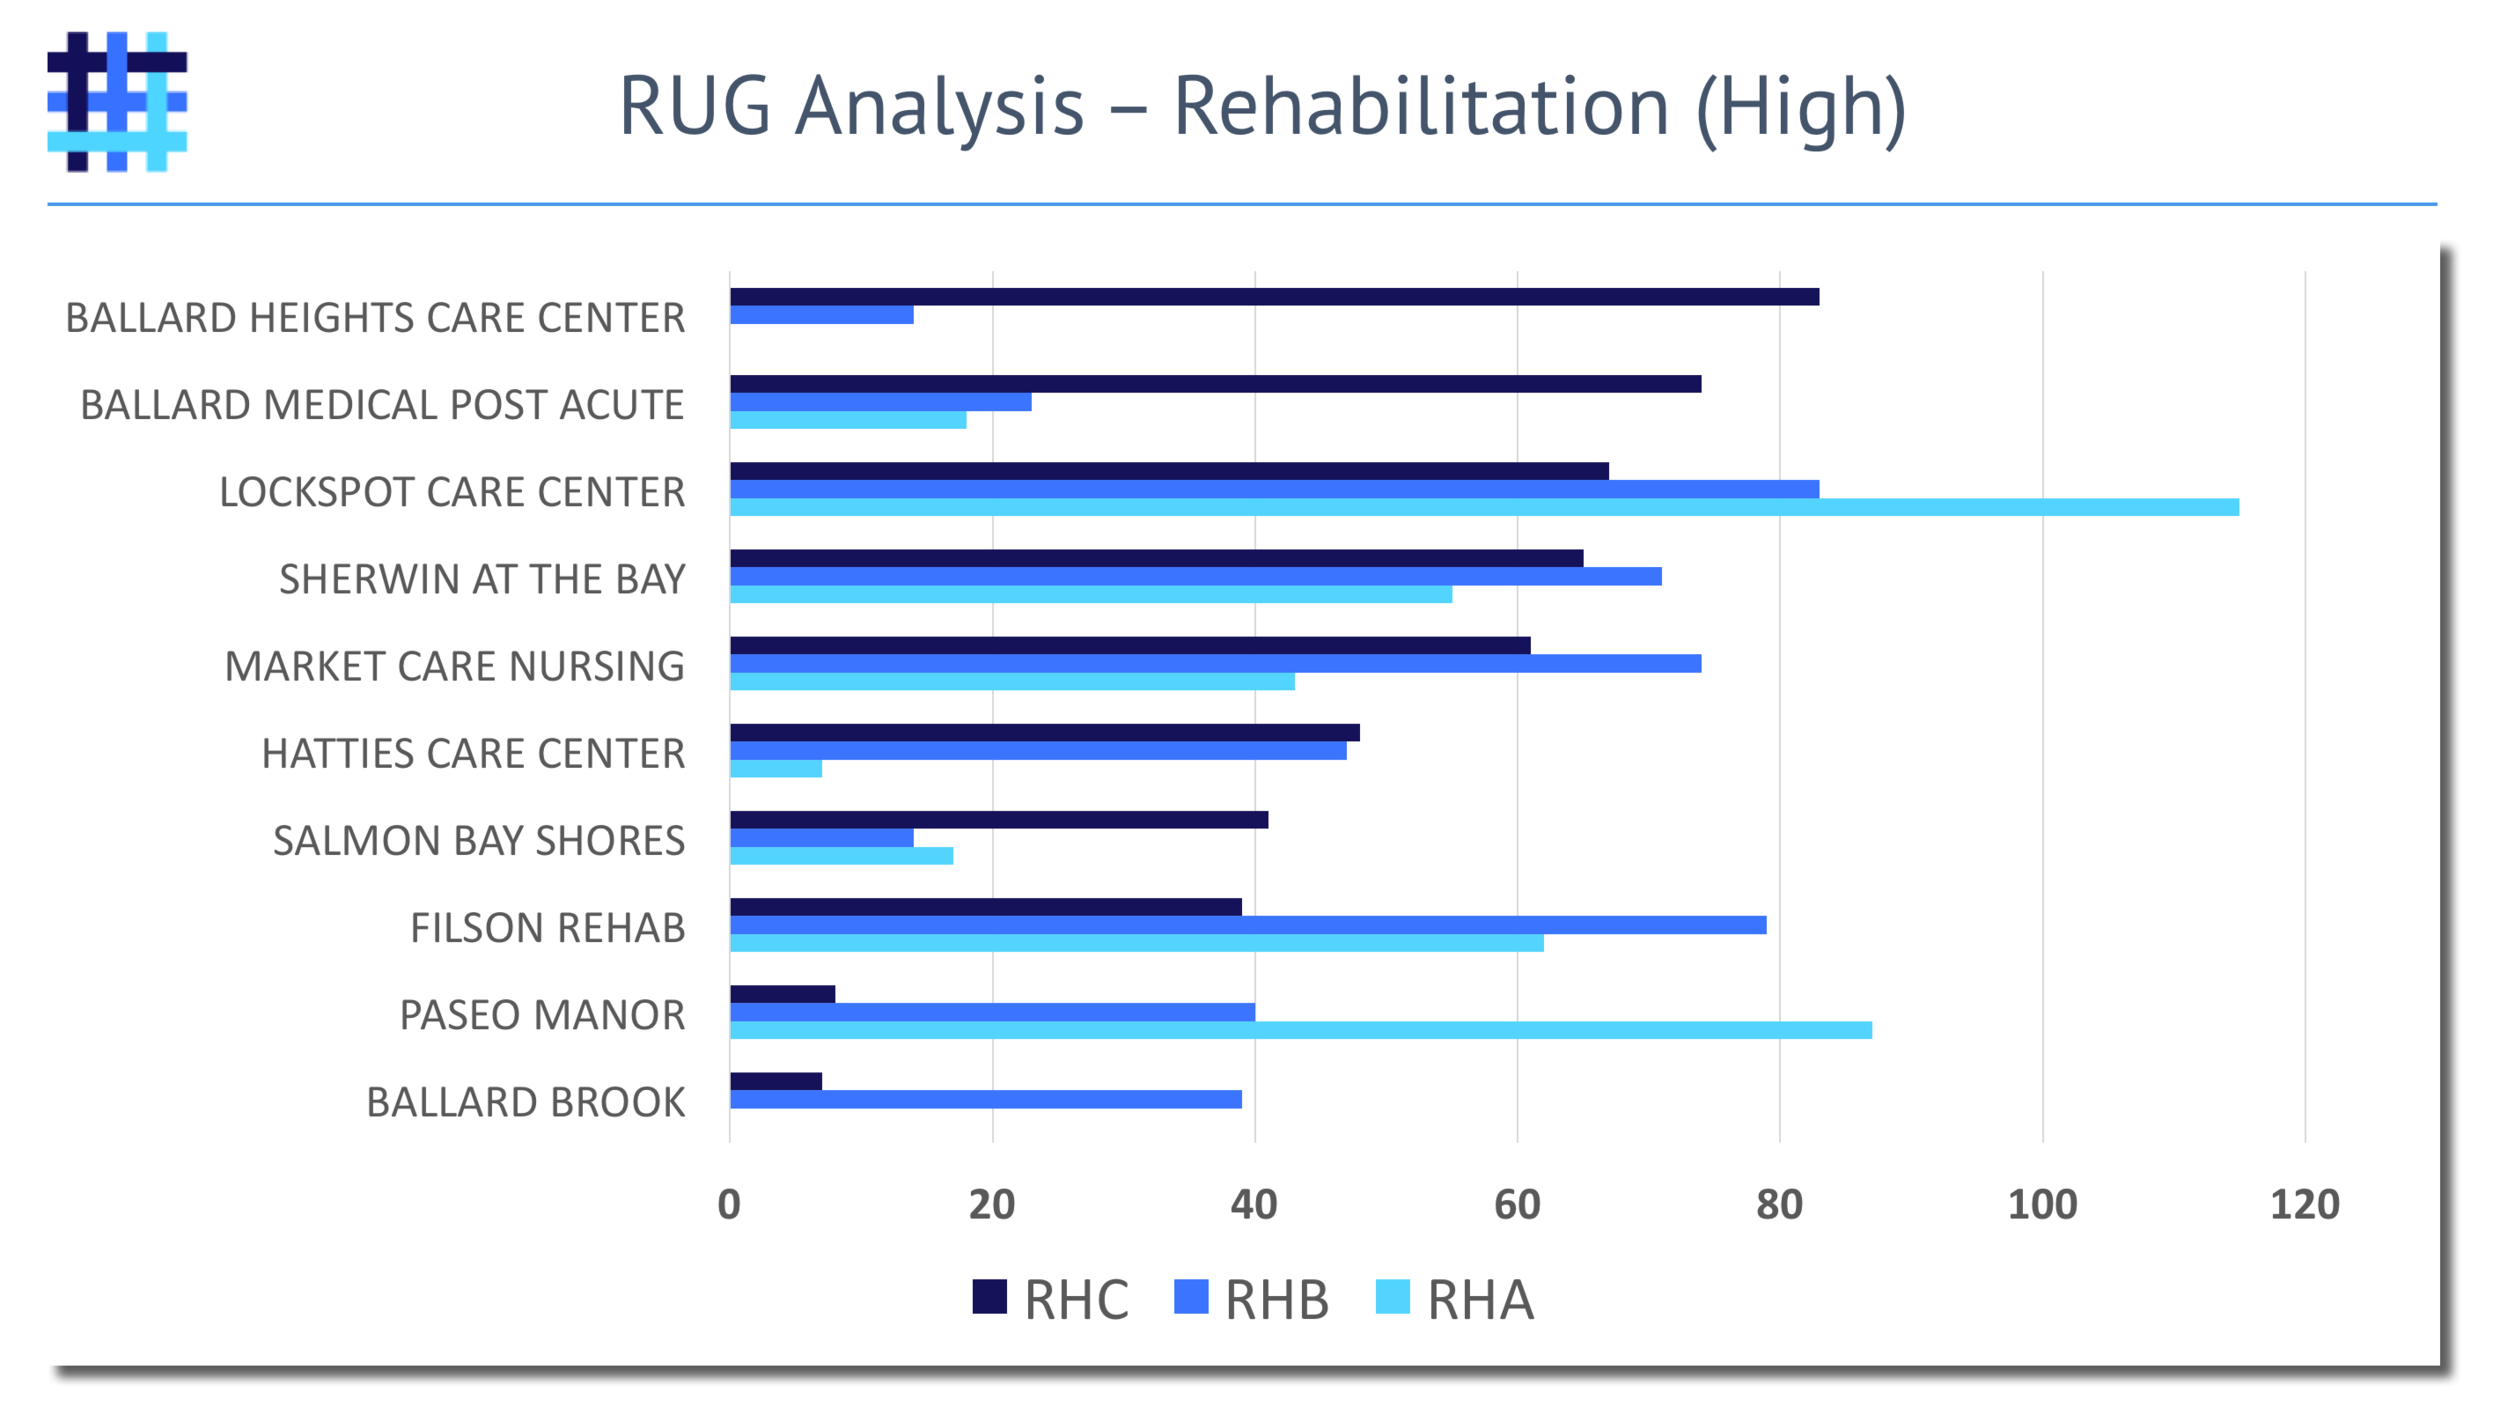
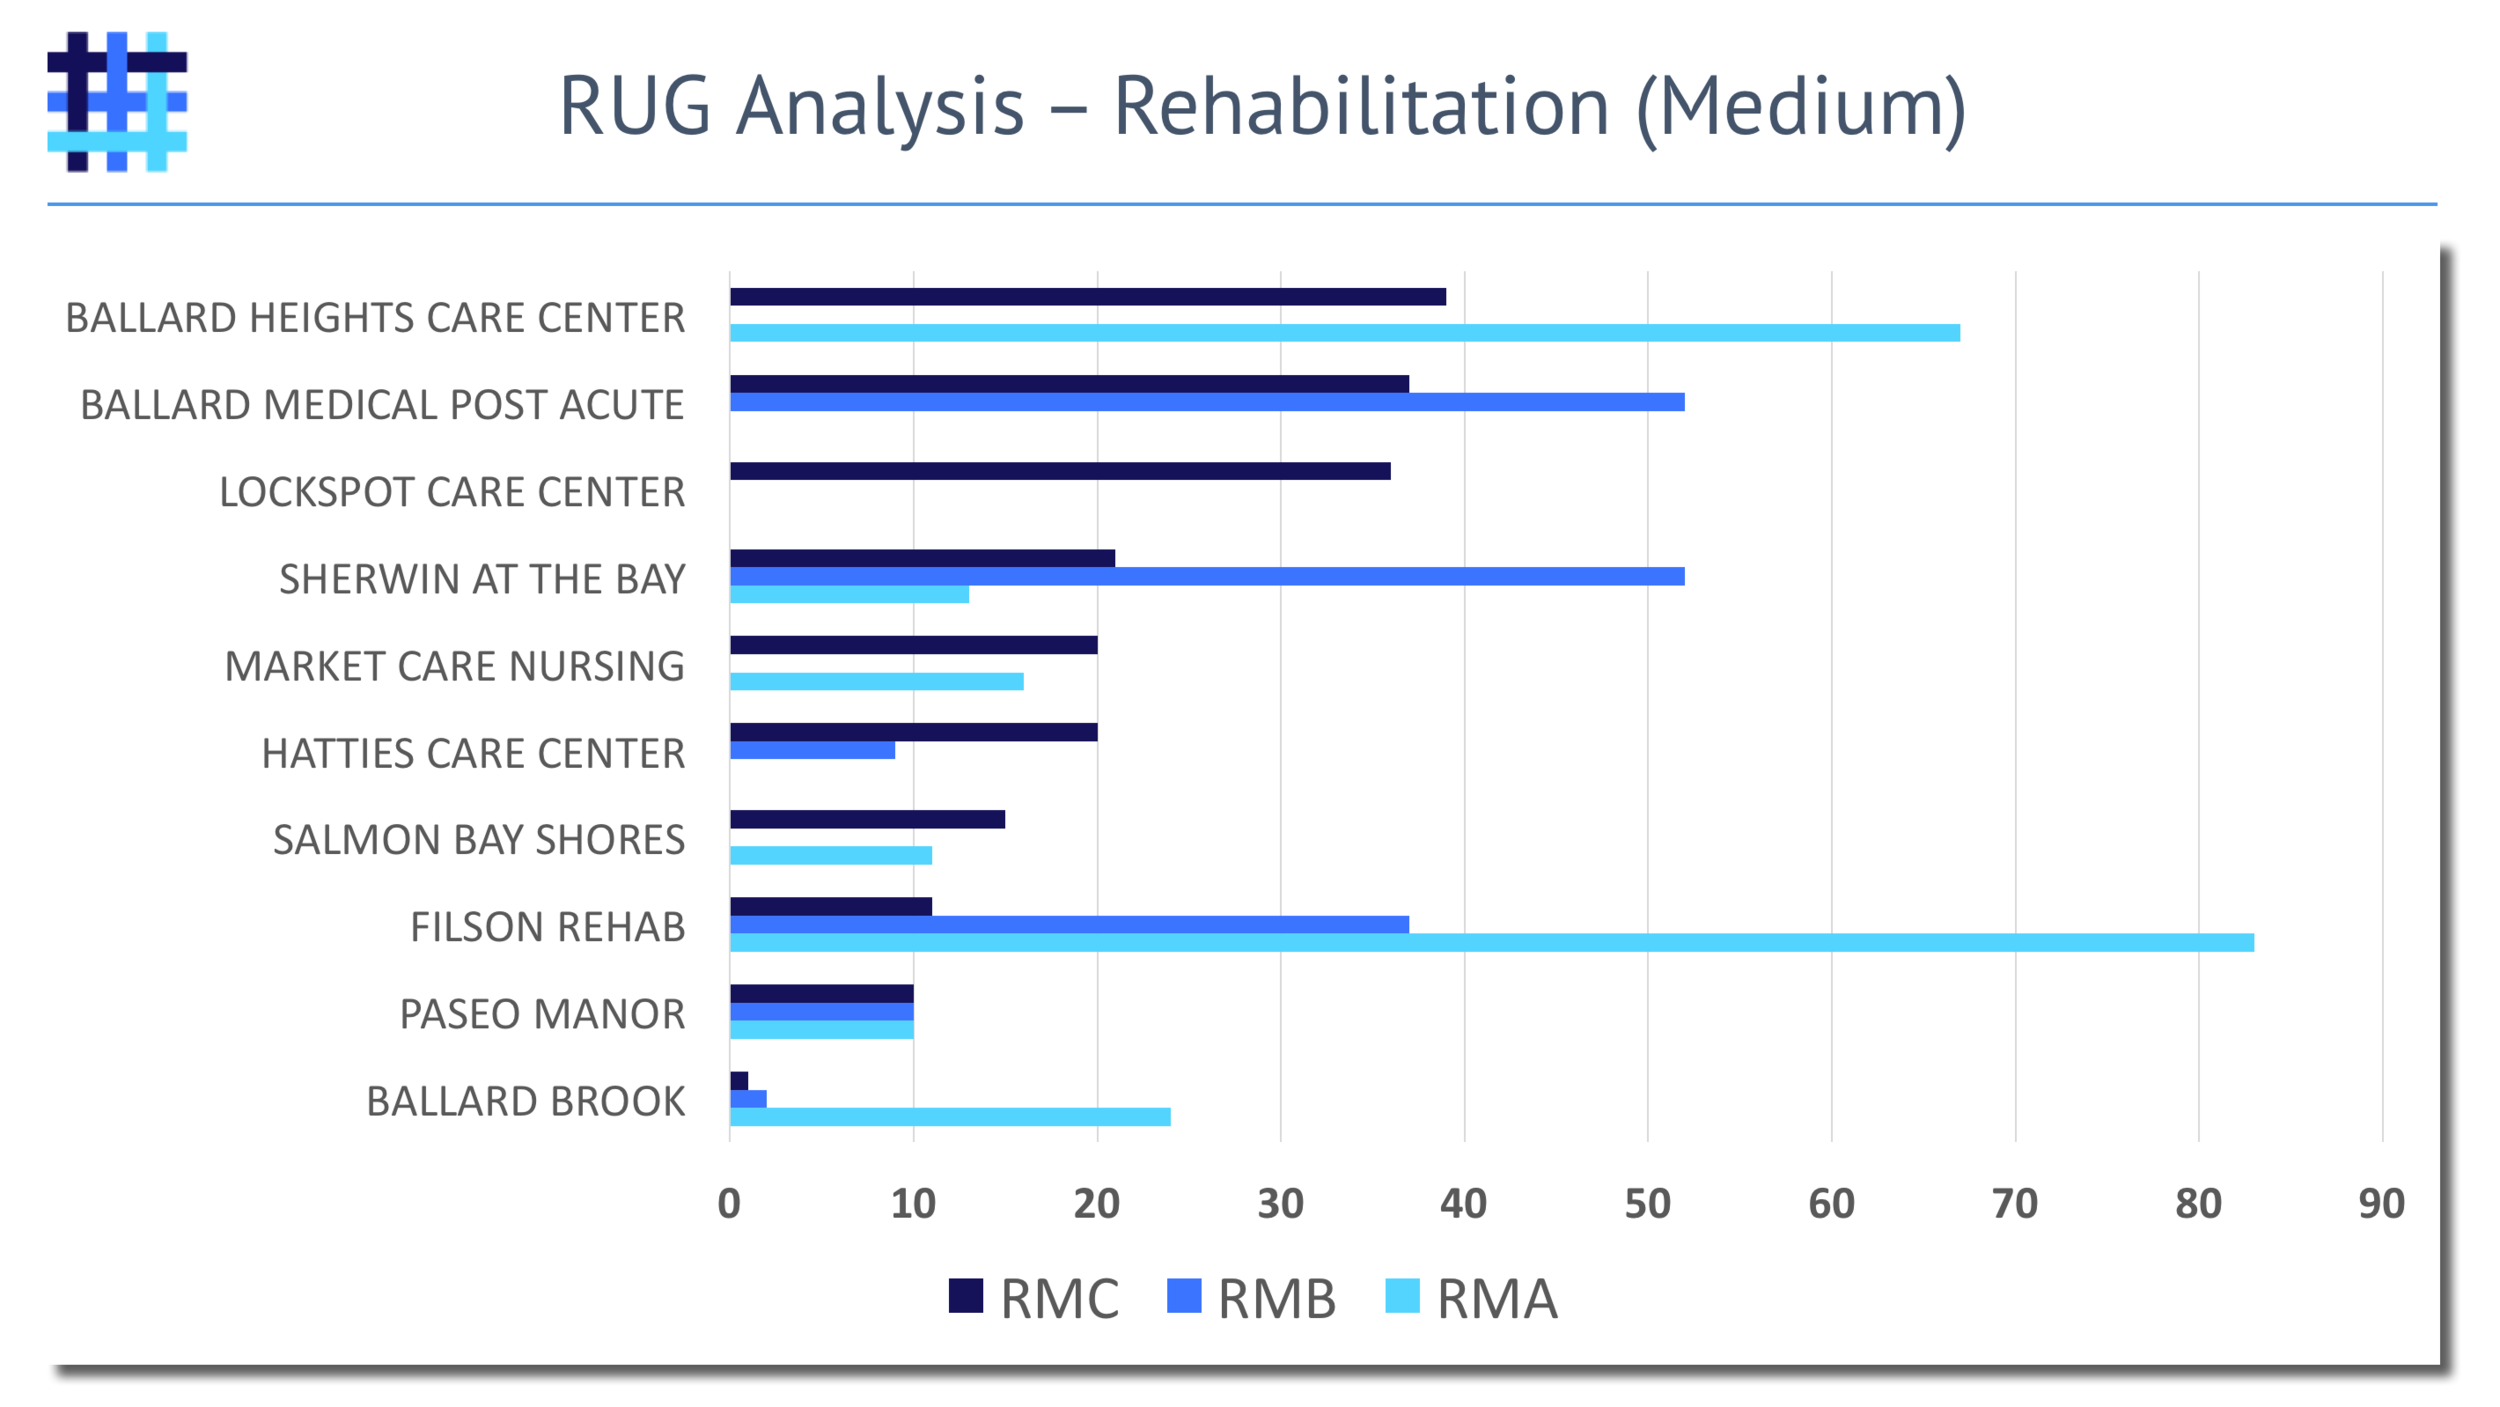
Medicare Nursing Home Resource Utilization Group (RUG) Competitive Analysis
Discover how your nursing home compares to others locally by RUG Category and Codes:
- Rehabilitation RUGs:
- Ultra-High: RUC, RUB, RUA
- Very High: RVC, RVB, RVA
- High: RHC, RHB, RHA
- Medium: RMC, RMB, RMA
- Low: RLB, RLA
- Rehabilitation Plus Extensive Services RUGs
- RUX, RUL, RVX, RVL, RHX, RHL, RMX, RML, RLX
- Extensive Services RUGs
- ES3, ES2, ES1
- ES3, ES2, ES1
- Special Care - High RUGs
- HE2, HE1, HD2, HD1, HC2, HC1, HB2, HB1
- Special Care - Low RUGs
- LE2, LE1, LD2, LD1, LC2, LC1, LB2, LB1
- Clinically Complex RUGs
- CE2, CE1, CD2, CD1, CC2, CC1, CB2, CB1, CA2, CA1
- Behavior Symptoms and Cognitive Performance RUGs
- BB2, BB1, BA2, BA1
- Reduced Physical Function RUGs
- PE2, PE1, PD2, PD1, PC2, PC1, PB2, PB1, PA2, PA1
- Default RUG (AAA)
Nursing Home Balance Sheet & Income Statement Comparisons
Find out how your balance sheet & income statements compares to other local nursing homes by:
- Total Patient Revenues
- Less: Contractual Allowances and Discounts
- Net Patient Revenues
- Total Operating Expenses
- Net Income from Service to Patients
- Net Income (or loss) for the Period (FY20XX)
- Asset Analysis
- Short-Term and Long-Term Liability Analyses
- Full Balance Sheet Breakdowns
Nursing Home Medicare Spend Per Beneficiary (MSPB) & Cost-to-Charge Ratios
The implementation of the Hospital Value-Based Purchasing (HVBP) Program now means a hospital's Medicare reimbursement is partially tied to the entire Medicare Spend Per Beneficiary (MSPB) episode. A 'MSPB episode' is defined by the three days prior to hospital admission through 30 days after hospital discharge.
With a new Medicare Skilled Nursing Facility (SNF) patient requiring a '3-Day Inpatient Hospital Stay' prior to becoming eligible for Medicare SNF benefits, it is critical for nursing home leaders to understand the Average Inpatient Routine Service Cost Per Day & Service-Cost-to-Charge-Ratios since the nursing home's performance is either improving or hurting the hospital's bottom-line.
Hospital to Nursing Home Referral Patterns
Find out which nursing homes in your area receive the most Medicare beneficiaries referrals, and how many, from your local hospitals.
- Total number of unique SNF Medicare beneficiaries with a claim-based shared patient pattern with the hospital within 30 day.
- You choose the hospitals you want included in your report, and we provide you with the actionable information to understand how you compare with other local nursing homes.
- Whether you out-perform the competition in Medicare Spending Per Beneficiary (MSPB) or CMS Quality Measure Performance, start helping your referral sources know why their patients are going to receive the best care at your facility versus others.
Custom Analytics for Nursing Home Leaders
Helping nursing home leaders uncover and transform big health datasets into actionable information is one of our passions.
Navigating the vast amount of data can be overwhelming for even the most experienced executives. Whether you are just interested in better understanding the datasets available, or if there is a major data project that needs expert oversight, let's get in touch to understand how we can help.
Our areas of expertise reach far beyond providing exceptional information to hospital, nursing home, and home health agency leaders.


